


Live market data
Crypto
Real-time prices, risk scores and what actually happened to people who held.
Moving today
Tap any of these to open the full read
Aave
136.16
+7.69% today
57% of years profitable
LayerZero
1.24
+7.25% today
1% of years profitable
Uniswap
4.50
+4.7% today
29% of years profitable
Injective
5.15
+4.28% today
2% of years profitable
XRP
1.52
+3.65% today
58% of years profitable
NEAR Protocol
1.95
+3.62% today
15% of years profitable
Chainlink
11.49
-1.37% today
36% of years profitable
Litecoin
52.07
-0.72% today
51% of years profitable
Cardano
0.2253
-0.31% today
53% of years profitable
Toncoin
1.60
-0.19% today
0% of years profitable
Every crypto at a glance
Size = how often it paid off · colour = today
up today
down today
flat
bigger bubble = higher share of profitable years
Ranked by how often a year ended in profit
$100 held for one year| Coin | Price | Today | Ended in profit | Bad year | Typical | Good year |
|---|---|---|---|---|---|---|
| BNB | 695.28 | +0% |
78%
|
$89 | $118 | $218 |
| XRP | 1.52 | +3.65% |
58%
|
$51 | $358 | $534 |
| Bitcoin | 77,180 | +0.14% |
57%
|
$60 | $128 | $218 |
| Aave | 136.16 | +7.69% |
57%
|
$33 | $138 | $317 |
| Stellar | 0.1988 | +1.64% |
56%
|
$48 | $214 | $408 |
| Sui | 0.8215 | +0.9% |
54%
|
$25 | $125 | $469 |
| Cardano | 0.2253 | -0.31% |
53%
|
$27 | $112 | $231 |
| Litecoin | 52.07 | -0.72% |
51%
|
$47 | $102 | $177 |
| Dogecoin | 0.09264 | +0.83% |
50%
|
$35 | $100 | $340 |
| Solana | 94.94 | +1.19% |
42%
|
$47 | $80 | $186 |
Showing 10 of 25. The full list and sorting by risk are Pro — every individual page stays free.
Crypto News
Live from CoinTelegraph
 MiCA is coming for DeFi vaults, but regulation will be difficult
CoinTelegraph · 1 day ago
MiCA is coming for DeFi vaults, but regulation will be difficult
CoinTelegraph · 1 day ago
 Here’s what happened in crypto today
CoinTelegraph · 1 day ago
Here’s what happened in crypto today
CoinTelegraph · 1 day ago
 Bitget CEO sees Bitcoin near current levels at year-end, doubts US will buy BTC
CoinTelegraph · 1 day ago
Bitget CEO sees Bitcoin near current levels at year-end, doubts US will buy BTC
CoinTelegraph · 1 day ago
 Ray Dalio says to buy ‘a bit’ of Bitcoin amid potential debt crisis
CoinTelegraph · 1 day ago
Ray Dalio says to buy ‘a bit’ of Bitcoin amid potential debt crisis
CoinTelegraph · 1 day ago
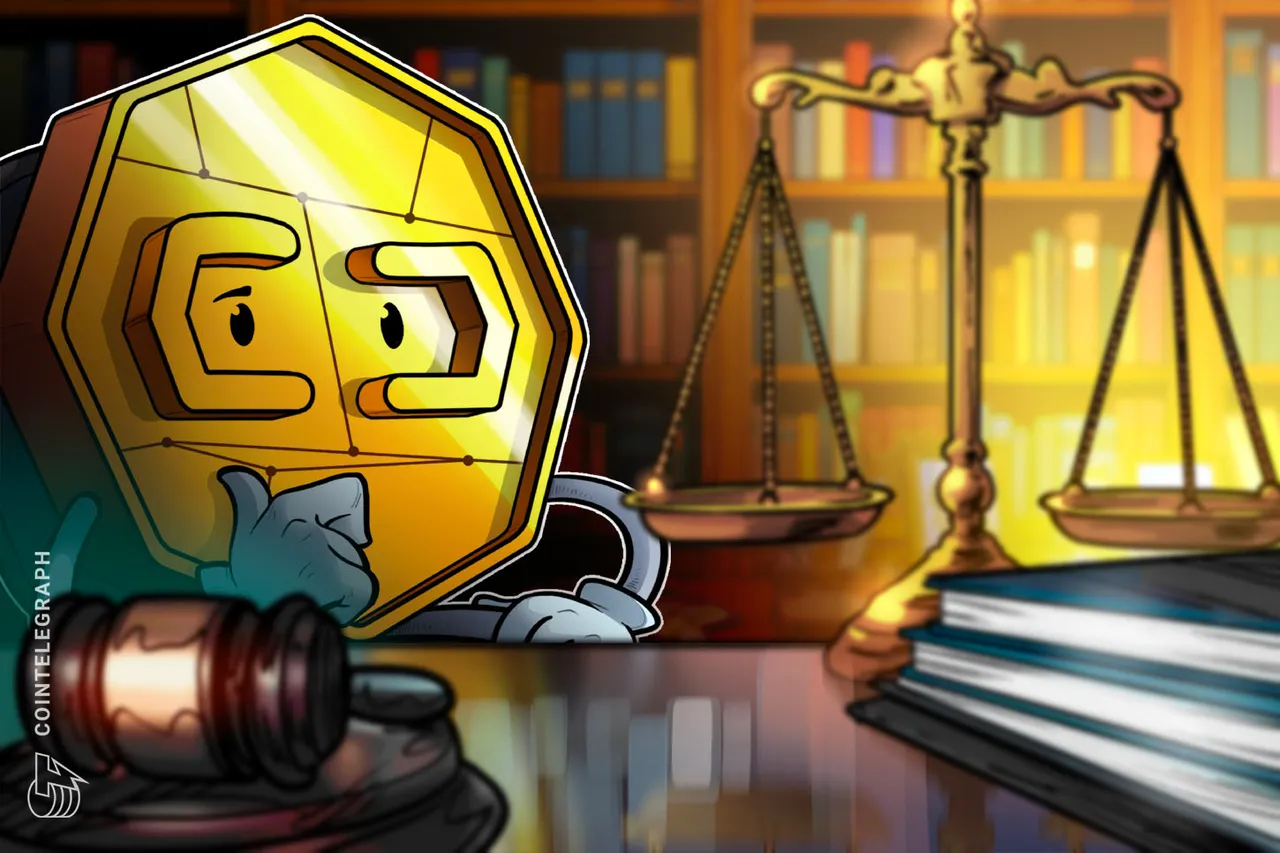 Onchain, in court: What happened in crypto legal news this week
CoinTelegraph · 1 day ago
Onchain, in court: What happened in crypto legal news this week
CoinTelegraph · 1 day ago
 Bitcoin seeks support near $77K as BTC, gold near 100-day highs
CoinTelegraph · 1 day ago
Bitcoin seeks support near $77K as BTC, gold near 100-day highs
CoinTelegraph · 1 day ago
 Digital Asset, Paul Ryan foundation target US state benefits with Canton pilot
CoinTelegraph · 1 day ago
Digital Asset, Paul Ryan foundation target US state benefits with Canton pilot
CoinTelegraph · 1 day ago
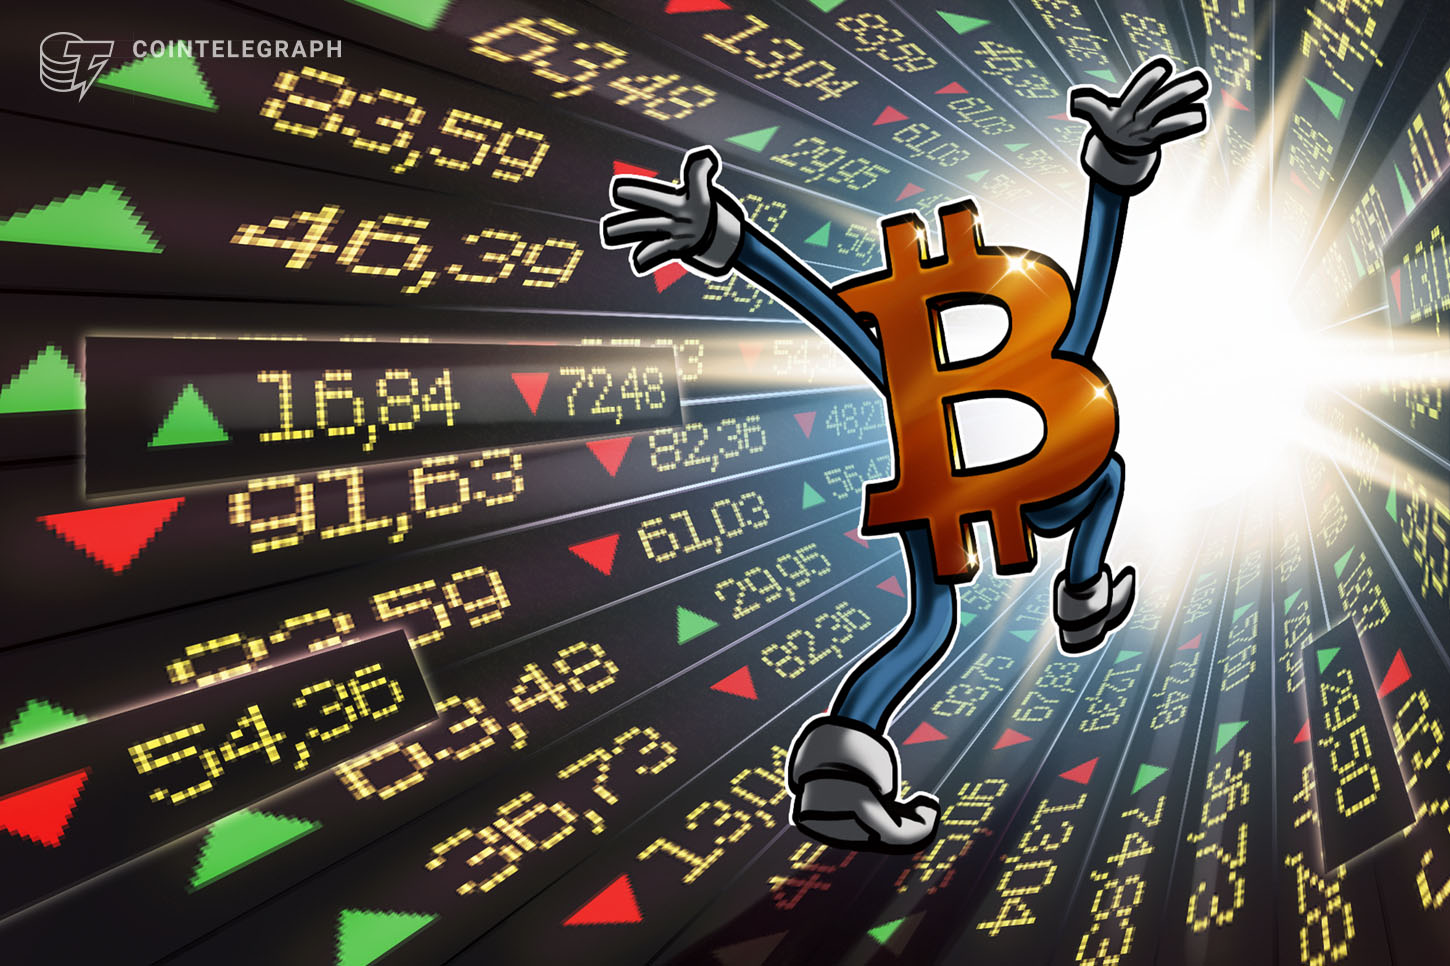 Bitcoin rally sends crypto stocks soaring as miners, treasury companies jump
CoinTelegraph · 1 day ago
Bitcoin rally sends crypto stocks soaring as miners, treasury companies jump
CoinTelegraph · 1 day ago
The analysis is free. Always.
Pro adds the work: the full list, every holding period from a month to a year,
crypto, stocks and currencies side by side, and filtering by win rate and risk.
How the win rate is worked out.
We take daily closing prices and, for every day with a full year of data after it, measure what a year
later looked like. "Typical" is the middle outcome; "bad year" and "good year" are the 10th and 90th
percentiles. Crypto uses 365 calendar days; shares and currencies use 252 trading days.
Fees, spread and tax are not included, and dividends are not counted.
Nothing here is a forecast or advice to buy or sell.
Buzdy is free to compare and takes no commission on what you do next.
—
Loading…
—
—
What the chart says
Have these signals worked here?
tested on its own historyHalfway is a coin flip. We show the weak ones too.
Bottom line
Working it out…
If you had put money in
$
Bad—
Typical—
Good—
—
Every past starting day, counted. History — not a forecast.
Risk
—
Higher means more can go wrong. Not advice.
Where today sits
AI
Ask me anything about this — in plain words. No question is too basic.
BUZDY AI · SELF-HOSTED
FREE